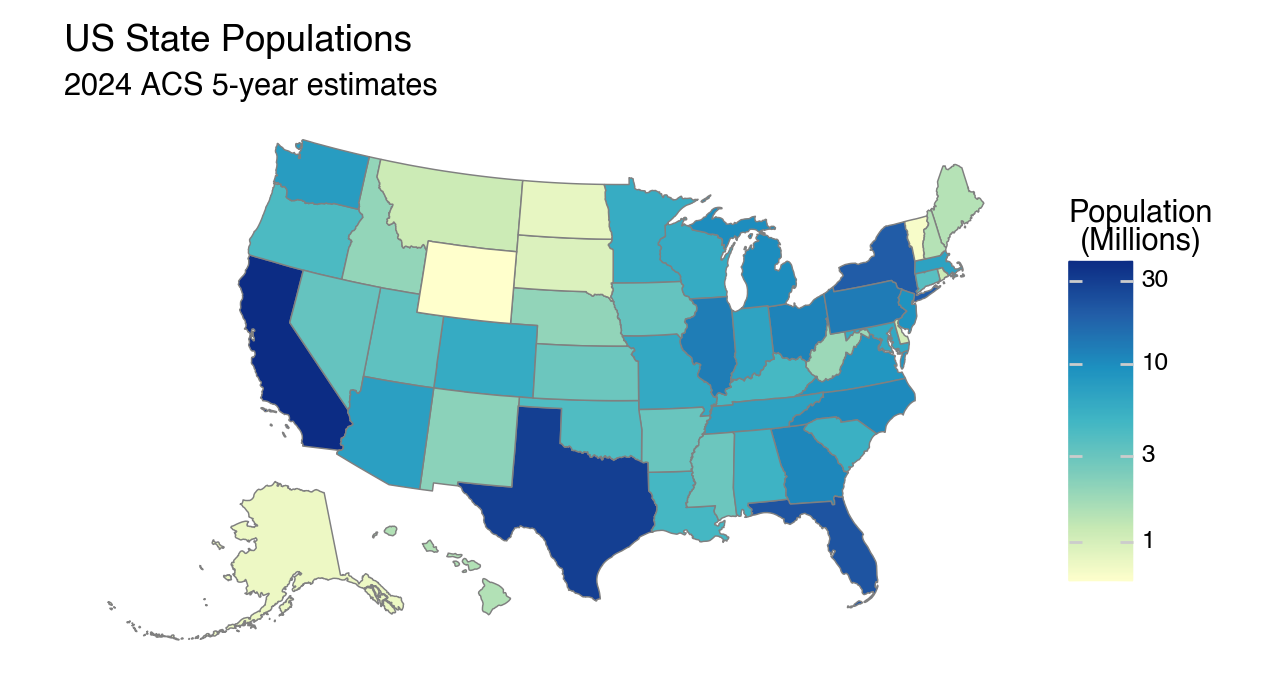
Maps are cool
Over the last 10 years I’ve taught a graduate level applied statistics course and at some point along the way I thought we should cover maps. Yes, I know, “maps” != “statistics”, but. . . maps are cool.
For my students in the field of environmental science, using maps to visualize their work is a relevant skill. For the rest of us? Well. . . maps are cool. It ends up, the R programming language has some excellent tools for generating maps. For many of my students, this course is their first experience using code to carryout data analyses and visualizations—for statistical methods, R is still a logical choice. There are some excellent packages in R built around the “Tidyverse” that make learning data manipulation (dplyr) and visualization (ggplot2) a great first language.
While I still use R for my course, much of my professional work has moved to Python.
R to Python
R is still a popular language; this is seen in several online indexes including TIOBE, where R is ranked #7—up from #12 just a year ago. R is not going away. Of course, Python is ranked #1 and has been the most popular general purpose language for at least five years. Two Python packages that facilitated my adoption of Python are Polars for data manipulation and Plotnine for visualizations.
The Polars’ community has adopted a saying that people “come for the speed and stay for the API.” Personally, I came for the API. It can’t replace Pandas (yet), but for data manipulation and transformation, it’s my preferred Python tool when working with data.
And Plotnine? From the matplotlib.org site
plotnine is an implementation of a grammar of graphics in Python. The grammar allows users to compose plots by explicitly mapping data to the visual objects that make up the plot.
The syntax is very similar to ggplot2. I love working in ggplot2 and Plotnine allows me to take those skills directly into a Python environment.
Choropleth Maps in Python
Until I had worked through this process, if I needed to make a map, I would have done it in R. I knew the framework that leveraged ggplot2 and I was able to get reproducible results. Unfortunately, it wasn’t a drop-in replacement. I’ve worked to document the equivalent workflow that allows a user to build choropleth maps in Python using Plotnine.
A choropleth map is a thematic map that uses color, shading, or patterns (pseudocolor) to represent statistical or numerical data aggregated over predefined geographic regions, such as states, counties, or countries —Wikipedia
I’ve posted a JupyterLab notebook on GitHub demonstrating how I worked through this task and hope it’s helpful if you’d like to use maps in your work.

