Can AI-assisted workflows really help?

I consider myself proficient in data analysis and enjoy the challenge of producing a good visualization. I’ve experimented with AI agents over the last several years now and have had mixed results. At times, it felt like the agent was getting in my way. For a recent project, I wanted to pull data from the SEC’s Electronic Data Gathering, Analysis, and Retrieval (EDGAR) system. Working with API calls is an area where I struggle, so I was hopeful this might be a good use case.

The goal of the project was to produce a simple graphic showing gross margins of selected U.S. semiconductor companies across three sectors that could be easily reproduced, updated with future data, or used to produce similar visualizations with a different or updated company list.

Overall, I was happy with the final result (Figure below).
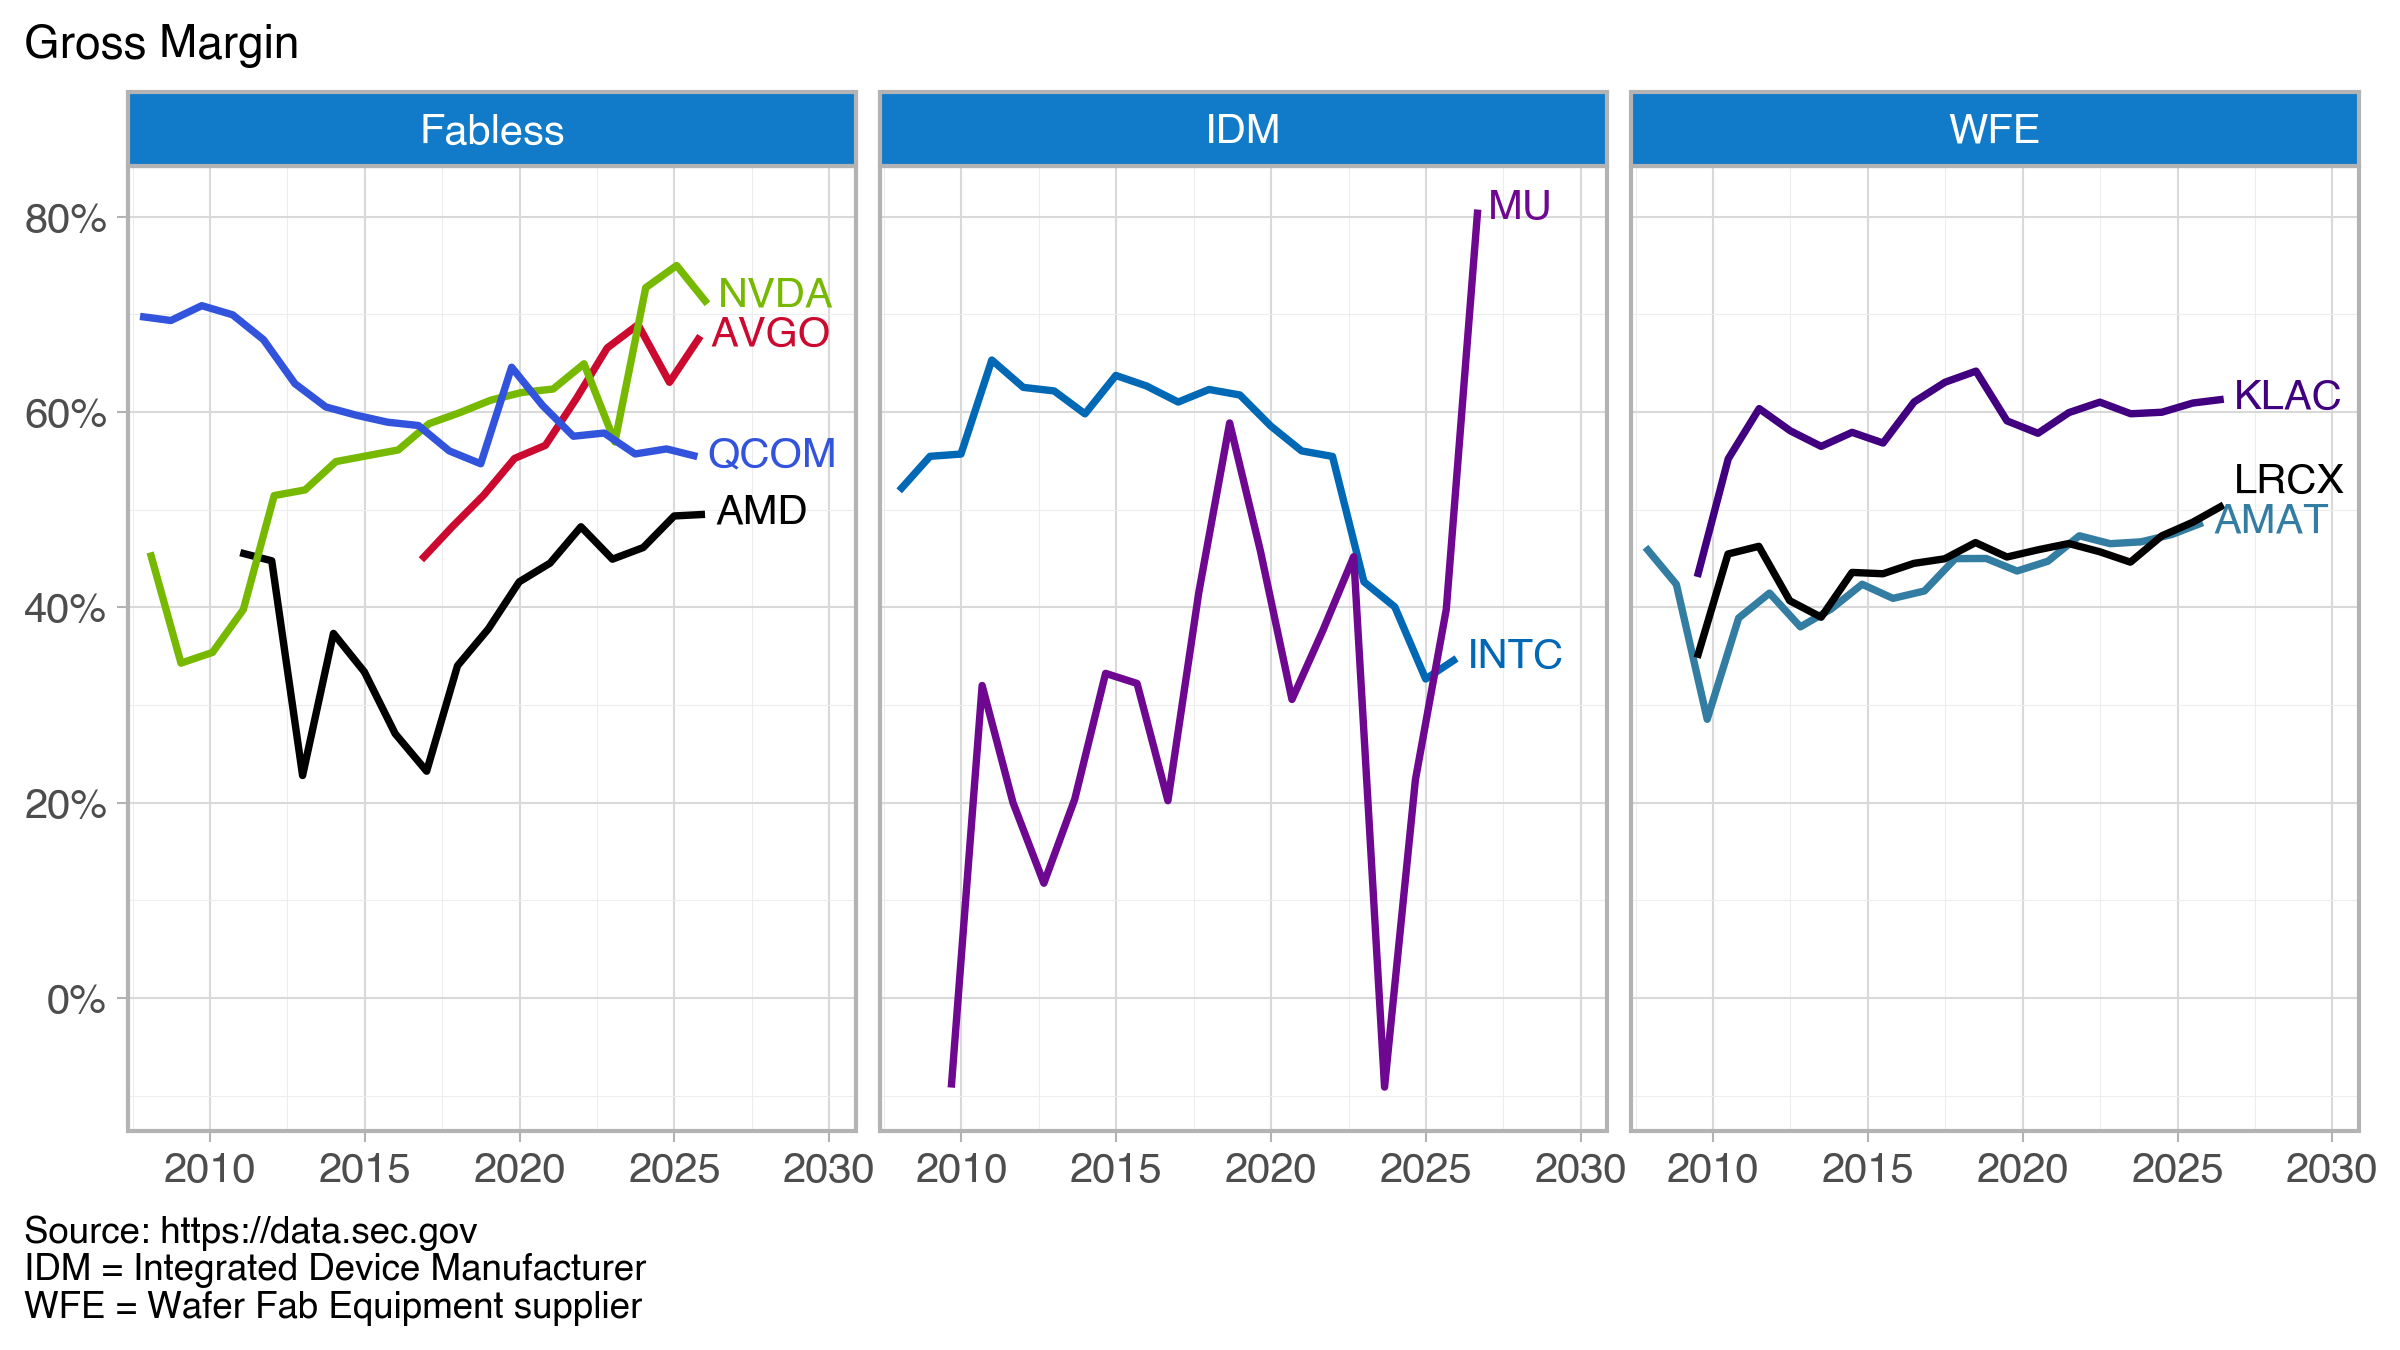
Line graph showing gross margin trends for Fabless companies, IDM (Integrated Device Manufacturers), and WFE (Wafer Fab Equipment suppliers) from 2010 to 2030, with notable companies indicated in each category.

At some point in the past, I would have manually pulled each company’s 10-K (annual) filing and dutifully entered the needed values into a spreadsheet as Excel was the tool I, like many, used and abused. Here, I pull data from data.sec.gov/api/xbrl/companyfacts/ using the API https://data.sec.gov/api/xbrl/companyfacts/CIK##########.json. This will provide all the company concepts data for a company returned in a single API call.

Code is available on GitHub

The basic steps:
– Get the SEC’s company identifier (CIK)
– Use the CIK in the above API call (produces a JSON file)
– Extract revenue, gross profit, and cost tags from the JSON file
– Calculate the gross margin as (revenue – cost)/revenue; some entries did not report a gross profit tag, so I compute it from the revenue and cost
– Combine each company’s data into a final data frame

The final data frame becomes the input for the visualization (created with Plotnine).

Where was the agent most helpful?

The agent was most helpful in creating functions that pulled tags for revenue, gross profit, and cost. For these companies, there were three different tags for revenue and two for cost. I’ve done similar tasks before and it has always been painful and having the AI agent write these functions was very helpful. The generated code was well-structured and reasonably commented. I’m sure my initial effort would have been less clean.

So where did I contribute? The Plotnine visualization. Plotnine is a Python implementation of R’s ggplot grammar of graphics. I’ve been working with ggplot for nearly a decade and with Plotnine since roughly 2023 when the tool seemed to reach a point of maturity and stability. I now have my favorite tool (which is built on Matplotlib functionality) in Python. This is where, frankly, I don’t need (or want) much help.

It took me a couple hours to pull everything together—without help, this would have been a good day’s worth of work.

Additional Info

“AI agent” == “Claude code”

Company names and trading symbols (ordered by revenue)

NameSymbol
NVIDIA CorporationNVDA
Broadcom Inc.AVGO
Intel CorporationINTC
QUALCOMM IncorporatedQCOM
Advanced Micro Devices, Inc.AMD
Micron Technology, Inc.MU
Applied Materials, Inc.AMAT
Lam Research CorporationLRCX
KLA CorporationKLAC

Companies fall into three sectors: fabless, integrated device manufacturers (IDM), and wafer fab equipment (WFE) suppliers.

Color Sources:
– NVIDIA, logo.dev (https://www.logo.dev/search/brands/nvidia.com)
– AMD, Brandpalettes (https://brandpalettes.com/amd-colors/)
– Broadcom, Designpieces
(https://www.designpieces.com/palette/broadcom-color-palette-hex-and-rgb/)
– Intel, Designpieces
(https://www.designpieces.com/palette/intel-color-palette-hex-and-rgb/)
– Micron, logo.dev (https://www.logo.dev/search/brands/micron.com)
– Applied Materials, logo.dev (https://www.logo.dev/search/brands/appliedmaterials.com)
– Lam Research, Brandpalettes (https://brandpalettes.com/lam-research-colors/)
– KLA, Brand Color Code (https://www.brandcolorcode.com/kla-corporation)
– Qualcomm (https://www.designpieces.com/palette/qualcomm-color-palette-hex-and-rgb/)
Don’t worry. . . you’ll be wrong

As a forecasting case study, I’ve been collecting data on silicon wafer shipments since 2019 where each October the remaining year and three future years are presented in a press release.

I don’t remember many details from the meeting where I was first asked to prepare a product forecast—I just remember the statement above. Over time I’ve became more comfortable in navigating both bottom-up and top-down forecasts and enjoy the data curation of the former and modeling of the latter.

When I talk with others (both colleagues and students), I always remind them not to worry; that they too will be wrong, but that it’s also good to remember the quote by statistician George Box, “Essentially, all models are wrong, but some are useful.” If the discussion continues for any length of time, we’ll undoubtedly fall into a discussion that addresses the usefulness of a forecast, i.e., forecasting accuracy. We know we’ll be wrong, but “how wrong” can we be and still be useful?

The global silicon wafer shipments and forecasts have been published for over a decade, and as an industry, we are fortunate this information is publicly available. I assume the forecast is a hybrid forecast using bottom-up, statistical, and judgmental methods.

But how good are the forecasts? What’s a reasonable error?

At first the results don’t look promising (Table 1).

HorizonMAPERMSPEn
00.841.207
17.779.596
218.3619.735
320.3622.374

Here

MAPE=1n∑t=1n∣yt−y^t∣yt×100

and

RMSPE=1n∑t=1n(yt−y^tyt)2×100n is the number of years available for the calculation.

So one year out, we’re looking at an error of 7–10%.

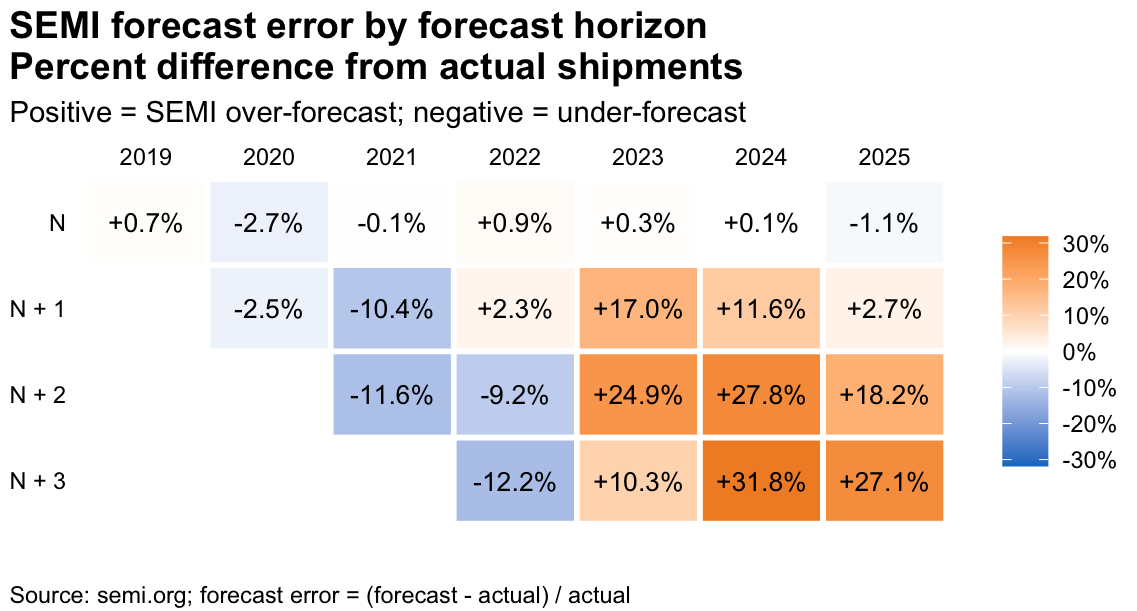
More interesting to me is how the forecast has gone through an inflection during this time (Table 2).

A table showing SEMI forecast error by forecast horizon, indicating the percentage difference from actual shipments for the years 2019 to 2025. Positive values indicate over-forecasting and negative values indicate under-forecasting.
Table 2: Forecast error by year, 2019-2025

Data from the original press release shows a downward trend ending in 2024 with a recovery starting last year.; this demonstrates the difficulty in capturing the magnitude and length of downturns and recoveries as errors move from negative to positive between 2022 and 2023.

Anyone who has worked in the semiconductor industry knows the industry is notoriously volatile, with forecasts being sensitive to memory pricing and capacity lags. Anyone (or organization) that’s willing to publish their forecast should be commended as having a general direction for the industry is valuable. Of course, details underlying the top-level forecast are available to further help professionals refine their own work. However, but even the top-level forecast can be used as a baseline value for independent analysis.

If you’re interested in discussing data visualization, technical education, or how we can build better analytical skills for these kinds of business contexts, I’d love to connect.

A 5-Week Passion Project

NIST/SEMATECH e-Handbook of Statistical Methods (Tidyverse Edition)

I’ve used the NIST/SEMATECH e-Handbook of Statistical Methods for nearly 20 years. First, as an applications scientist working for a semiconductor capital equipment company and later as an educator teaching a graduate level applied statistics course. A guiding principle of the book is to make the examples and case studies accessible with most allowing the reader to work out the problems by hand. While the book promotes the use of NIST’s Dataplot software, it was straight forward to adapt the case studies to R. Overall, this online book is a valuable resource.

My biggest complaint? The format—which uses dedicated HTML pages for each subsection of each chapter. This makes the book hard to navigate when you know what you’re looking for and nearly impossible to browse when you don’t.

Over the last year, I, like many people have been experimenting with LLMs and was curious if I could leverage an LLM to convert this e-Handbook into a Quarto book. After a month of work (okay, five weeks—which was more than I expected), I have a working Quarto book on GitHub. What I refer to as the “Tidyverse Edition.”

My goal was to stay faithful to the original text and only update the in-text examples, graphics, and case studies with reproducible R code that leans heavily on the tools of the Tidyverse (dplyr, ggplot2, etc.). That said, I did try to correct minor typos or inconsistencies when found and document more serious issues (which were few) with call-out notes where appropriate.

The original e-Handbook was released into the public domain and this effort follows their convention.

Was this a worthwhile project? Yes, I think so. Over the last several years there have been several instances where, during a semester, the NIST website was unavailable due to a government shutdown. While an archived version of the e-Handbook is available for download, this is less than idea for most students. Additionally, there seems to be a risk that this type of government work may be removed from public view if it’s deemed unnecessary or no longer considered a government responsibility.

Was this project appropriate use of an LLM? Definitely. I estimate that manually editing the original document, even with tools like pandoc, the project would have become a part-time endeavor taking many months, or years instead of a full-time effort over five weeks.

Finally, I hope others might be inspired to use this repository as a launching point for their own projects. Several of the chapters could easily become their own dedicated books and there are opportunities to build new case studies from other industries.