As a forecasting case study, I’ve been collecting data on silicon wafer shipments since 2019 where each October the remaining year and three future years are presented in a press release.
I don’t remember many details from the meeting where I was first asked to prepare a product forecast—I just remember the statement above. Over time I’ve became more comfortable in navigating both bottom-up and top-down forecasts and enjoy the data curation of the former and modeling of the latter.
When I talk with others (both colleagues and students), I always remind them not to worry; that they too will be wrong, but that it’s also good to remember the quote by statistician George Box, “Essentially, all models are wrong, but some are useful.” If the discussion continues for any length of time, we’ll undoubtedly fall into a discussion that addresses the usefulness of a forecast, i.e., forecasting accuracy. We know we’ll be wrong, but “how wrong” can we be and still be useful?
The global silicon wafer shipments and forecasts have been published for over a decade, and as an industry, we are fortunate this information is publicly available. I assume the forecast is a hybrid forecast using bottom-up, statistical, and judgmental methods.
But how good are the forecasts? What’s a reasonable error?
At first the results don’t look promising (Table 1).
| Horizon | MAPE | RMSPE | n |
|---|---|---|---|
| 0 | 0.84 | 1.20 | 7 |
| 1 | 7.77 | 9.59 | 6 |
| 2 | 18.36 | 19.73 | 5 |
| 3 | 20.36 | 22.37 | 4 |
Here
and
n is the number of years available for the calculation.
So one year out, we’re looking at an error of 7–10%.
More interesting to me is how the forecast has gone through an inflection during this time (Table 2).
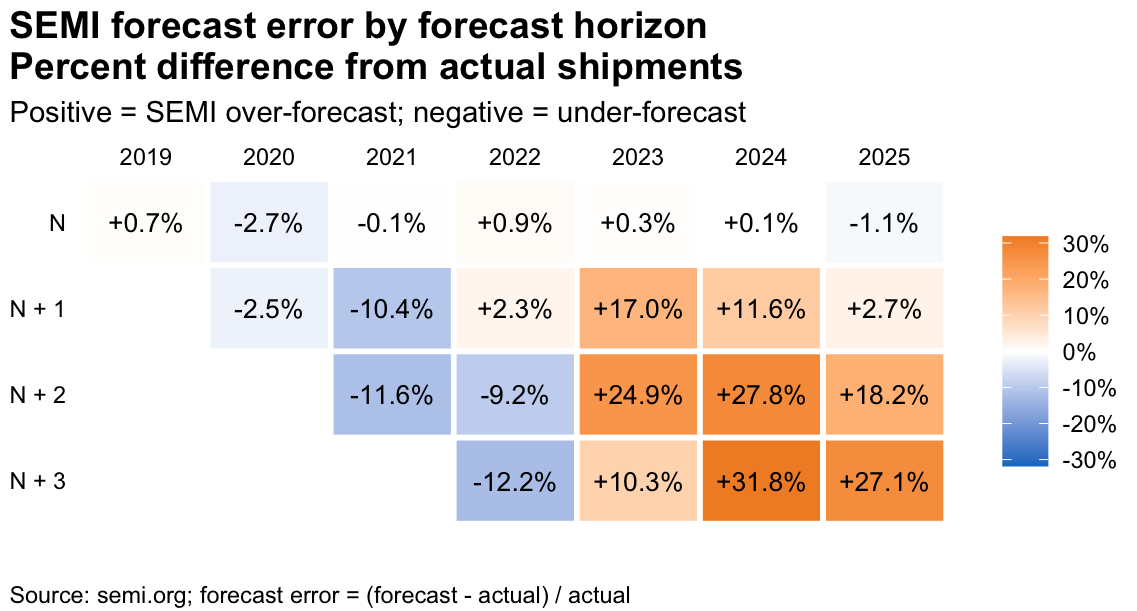
Data from the original press release shows a downward trend ending in 2024 with a recovery starting last year.; this demonstrates the difficulty in capturing the magnitude and length of downturns and recoveries as errors move from negative to positive between 2022 and 2023.
Anyone who has worked in the semiconductor industry knows the industry is notoriously volatile, with forecasts being sensitive to memory pricing and capacity lags. Anyone (or organization) that’s willing to publish their forecast should be commended as having a general direction for the industry is valuable. Of course, details underlying the top-level forecast are available to further help professionals refine their own work. However, but even the top-level forecast can be used as a baseline value for independent analysis.
If you’re interested in discussing data visualization, technical education, or how we can build better analytical skills for these kinds of business contexts, I’d love to connect.

