I consider myself proficient in data analysis and enjoy the challenge of producing a good visualization. I’ve experimented with AI agents over the last several years now and have had mixed results. At times, it felt like the agent was getting in my way. For a recent project, I wanted to pull data from the SEC’s Electronic Data Gathering, Analysis, and Retrieval (EDGAR) system. Working with API calls is an area where I struggle, so I was hopeful this might be a good use case.
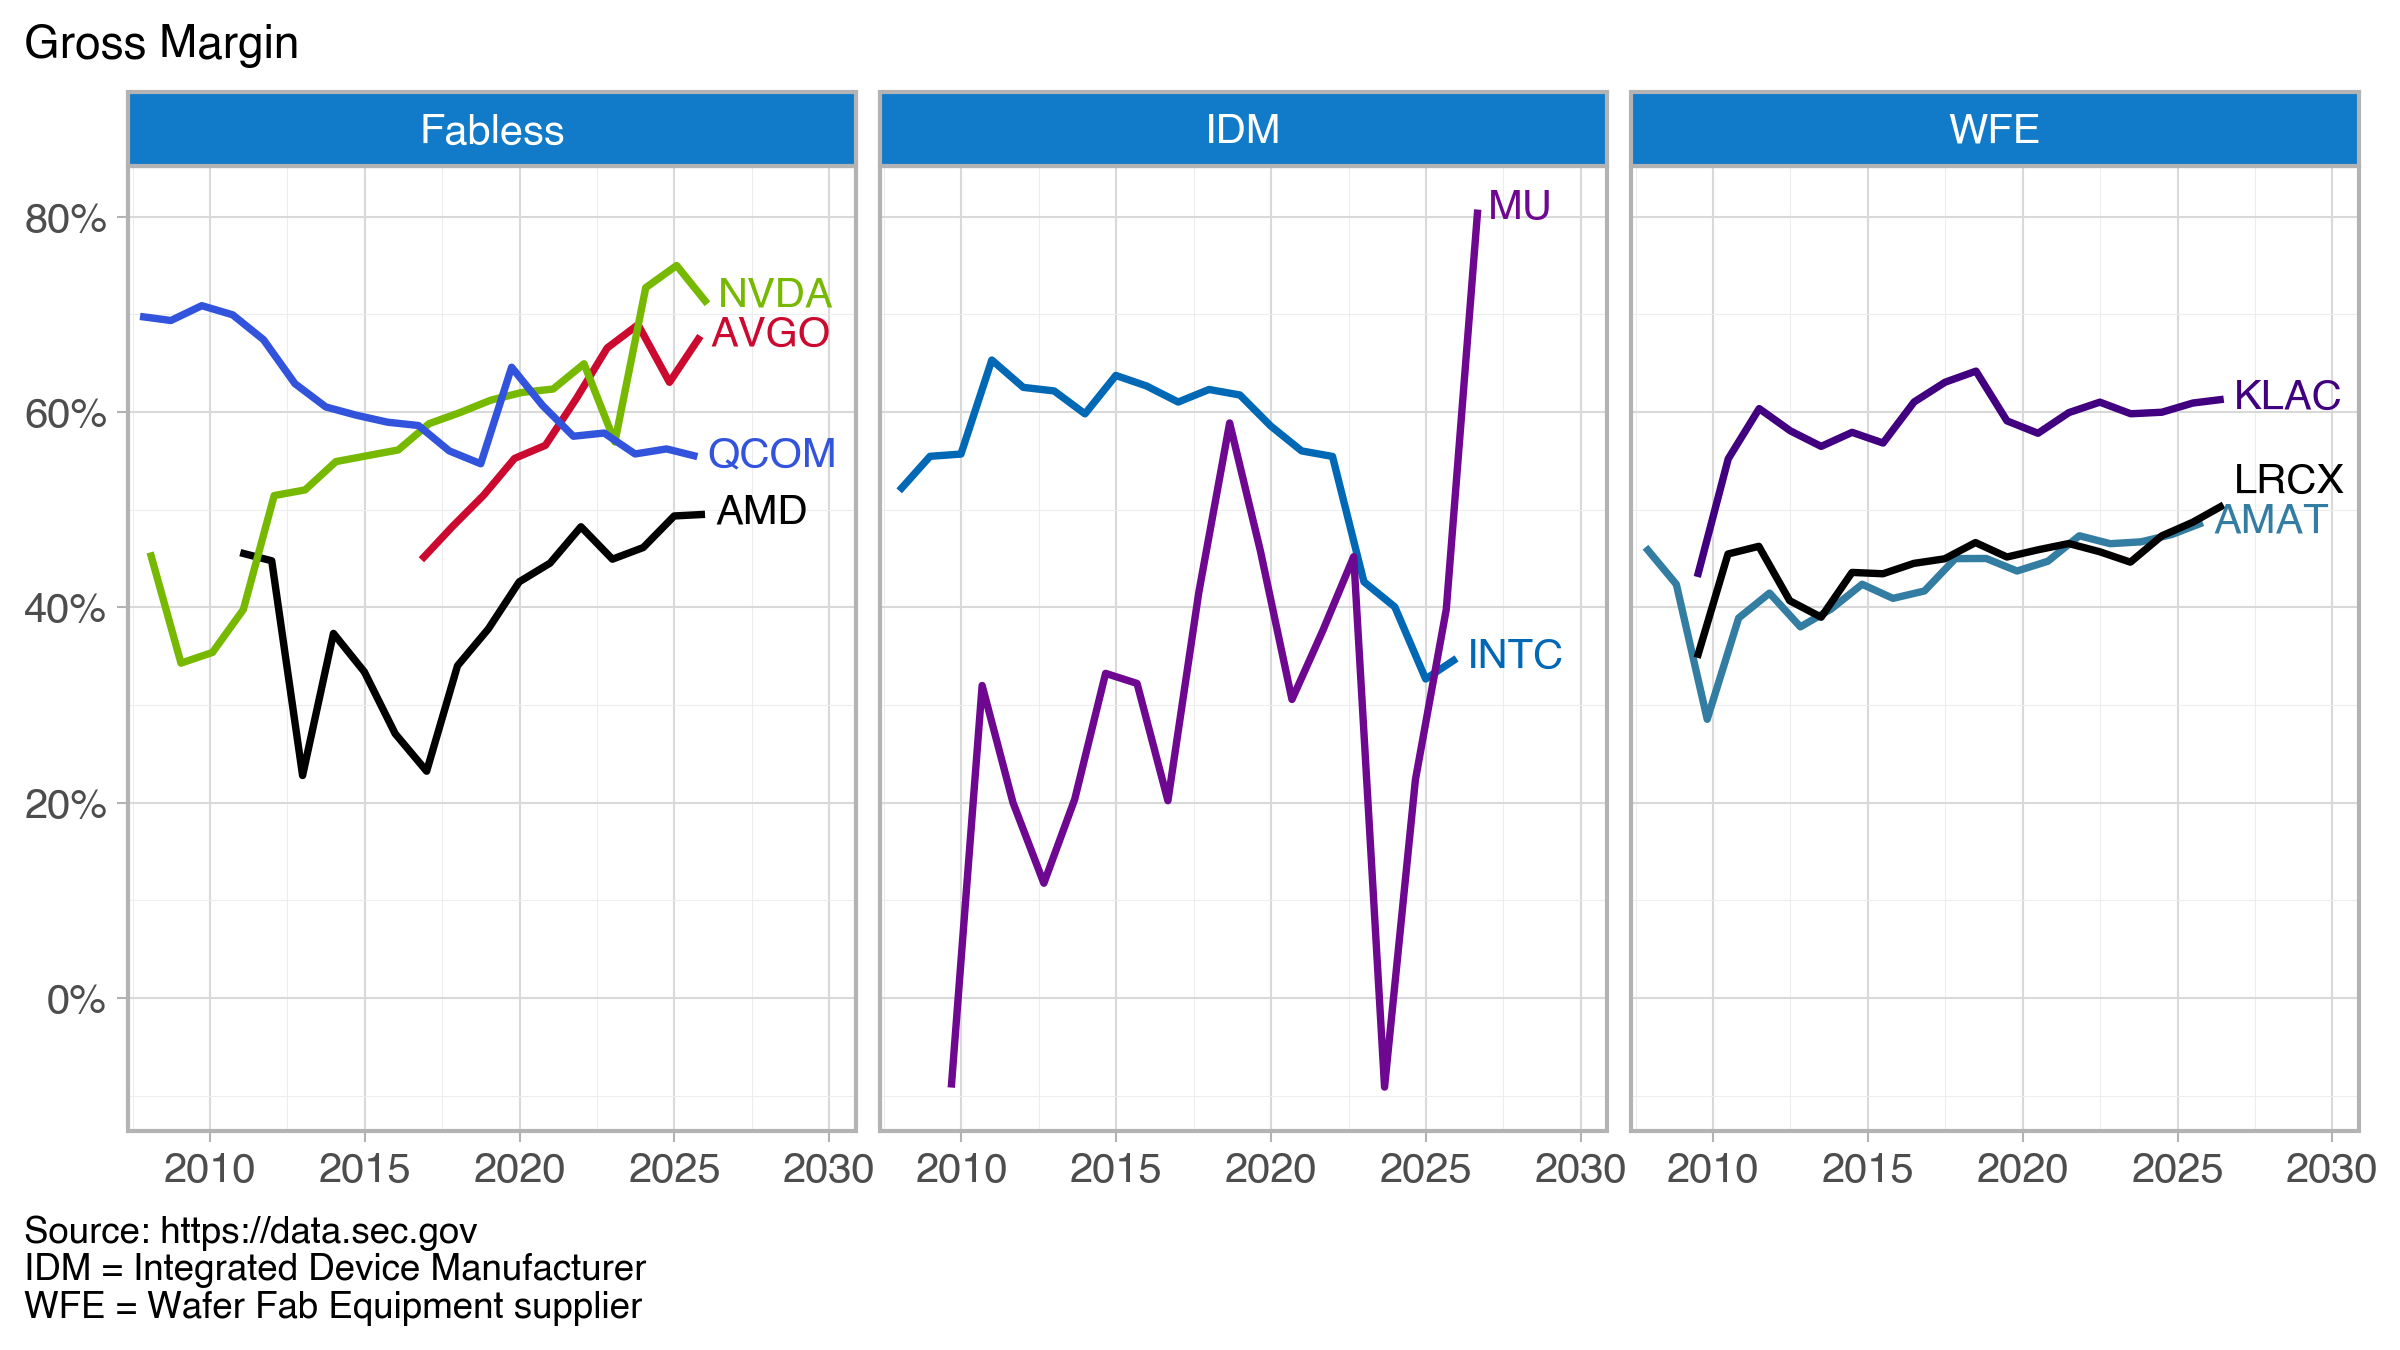
The goal of the project was to produce a simple graphic showing gross margins of selected U.S. semiconductor companies across three sectors that could be easily reproduced, updated with future data, or used to produce similar visualizations with a different or updated company list.
Overall, I was happy with the final result (Figure below).
At some point in the past, I would have manually pulled each company’s 10-K (annual) filing and dutifully entered the needed values into a spreadsheet as Excel was the tool I, like many, used and abused. Here, I pull data from data.sec.gov/api/xbrl/companyfacts/ using the API https://data.sec.gov/api/xbrl/companyfacts/CIK##########.json. This will provide all the company concepts data for a company returned in a single API call.
Code is available on GitHub
The basic steps:
– Get the SEC’s company identifier (CIK)
– Use the CIK in the above API call (produces a JSON file)
– Extract revenue, gross profit, and cost tags from the JSON file
– Calculate the gross margin as (revenue – cost)/revenue; some entries did not report a gross profit tag, so I compute it from the revenue and cost
– Combine each company’s data into a final data frame
The final data frame becomes the input for the visualization (created with Plotnine).
Where was the agent most helpful?
The agent was most helpful in creating functions that pulled tags for revenue, gross profit, and cost. For these companies, there were three different tags for revenue and two for cost. I’ve done similar tasks before and it has always been painful and having the AI agent write these functions was very helpful. The generated code was well-structured and reasonably commented. I’m sure my initial effort would have been less clean.
So where did I contribute? The Plotnine visualization. Plotnine is a Python implementation of R’s ggplot grammar of graphics. I’ve been working with ggplot for nearly a decade and with Plotnine since roughly 2023 when the tool seemed to reach a point of maturity and stability. I now have my favorite tool (which is built on Matplotlib functionality) in Python. This is where, frankly, I don’t need (or want) much help.
It took me a couple hours to pull everything together—without help, this would have been a good day’s worth of work.
Additional Info
“AI agent” == “Claude code”
Company names and trading symbols (ordered by revenue)
| Name | Symbol |
|---|---|
| NVIDIA Corporation | NVDA |
| Broadcom Inc. | AVGO |
| Intel Corporation | INTC |
| QUALCOMM Incorporated | QCOM |
| Advanced Micro Devices, Inc. | AMD |
| Micron Technology, Inc. | MU |
| Applied Materials, Inc. | AMAT |
| Lam Research Corporation | LRCX |
| KLA Corporation | KLAC |
Companies fall into three sectors: fabless, integrated device manufacturers (IDM), and wafer fab equipment (WFE) suppliers.
Color Sources:
– NVIDIA, logo.dev (https://www.logo.dev/search/brands/nvidia.com)
– AMD, Brandpalettes (https://brandpalettes.com/amd-colors/)
– Broadcom, Designpieces
(https://www.designpieces.com/palette/broadcom-color-palette-hex-and-rgb/)
– Intel, Designpieces
(https://www.designpieces.com/palette/intel-color-palette-hex-and-rgb/)
– Micron, logo.dev (https://www.logo.dev/search/brands/micron.com)
– Applied Materials, logo.dev (https://www.logo.dev/search/brands/appliedmaterials.com)
– Lam Research, Brandpalettes (https://brandpalettes.com/lam-research-colors/)
– KLA, Brand Color Code (https://www.brandcolorcode.com/kla-corporation)
– Qualcomm (https://www.designpieces.com/palette/qualcomm-color-palette-hex-and-rgb/)

